Geospatial ML for New Store Site Selection & Sales Forecasting
Databricks | Spark | XGBoost | Geospatial Intelligence | MLflow
Executive Summary
This project delivers a production-grade geospatial ML system for New-to-Industry (NTI) retail site selection at a $10B+ convenience & prepared foods retailer (2,500+ locations).
The system replaces intuition-driven real estate decisions with a low-latency ML inference engine that generates 3-year category-wise sales forecasts from a simple latitude/longitude input, reducing evaluation time from weeks to seconds and delivering a 15% accuracy lift over industry-standard 3rd-party tools.
1. Business Problem
The Core Issue
Real estate expansion decisions were:
- Decentralized
- Qualitative
- Inconsistent across regions
- High risk due to long-term CAPEX and lease commitments
The organization lacked:
- Standardized evaluation criteria
- Quantitative risk assessment
- Scalability across geographies
Objective
Build a data-driven site selection engine that:
- Eliminates regional bias
- Quantifies upside and risk
- Scales across the entire US footprint
- Produces explainable forecasts for capital allocation decisions
2. Why Machine Learning (and Not Rules or BI)
Why BI Failed
- Retrospective only
- No inferential capability for unseen geographies
- Manual heuristics didn’t scale
- Reinforced human bias
Why ML Was Required
-
1,700 heterogeneous features (demographics, mobility, infrastructure)
- Strong non-linear interactions
- High-dimensional spatial relationships
- Cold-start problem for NTI locations
Impact
- 10× throughput for site evaluation
- Standardized investment scoring
- Seconds-level inference latency
- Bias reduction in multi-million dollar decisions
3. Platform & Architectural Choices
Why Databricks
- Managed Spark removed infrastructure overhead
- Native support for:
- Large-scale geospatial joins
- Distributed feature engineering
- MLflow-based governance
- Faster time-to-market than raw AWS primitives
4. Data Landscape
Data Sources
| Domain | Source | Purpose |
|---|---|---|
| Human Mobility | Placer.ai | Footfall & traffic behavior |
| Demographics | US Census | Socio-economic context |
| Infrastructure | AADT + OSM | Traffic & accessibility |
| Store History | PostgreSQL | Sales ground truth |
Data Hygiene Decisions
- Excluded stores:
< 1.5 years(grand opening bias)> 5 years(legacy market conditions)
- Final training set: 10 years curated history
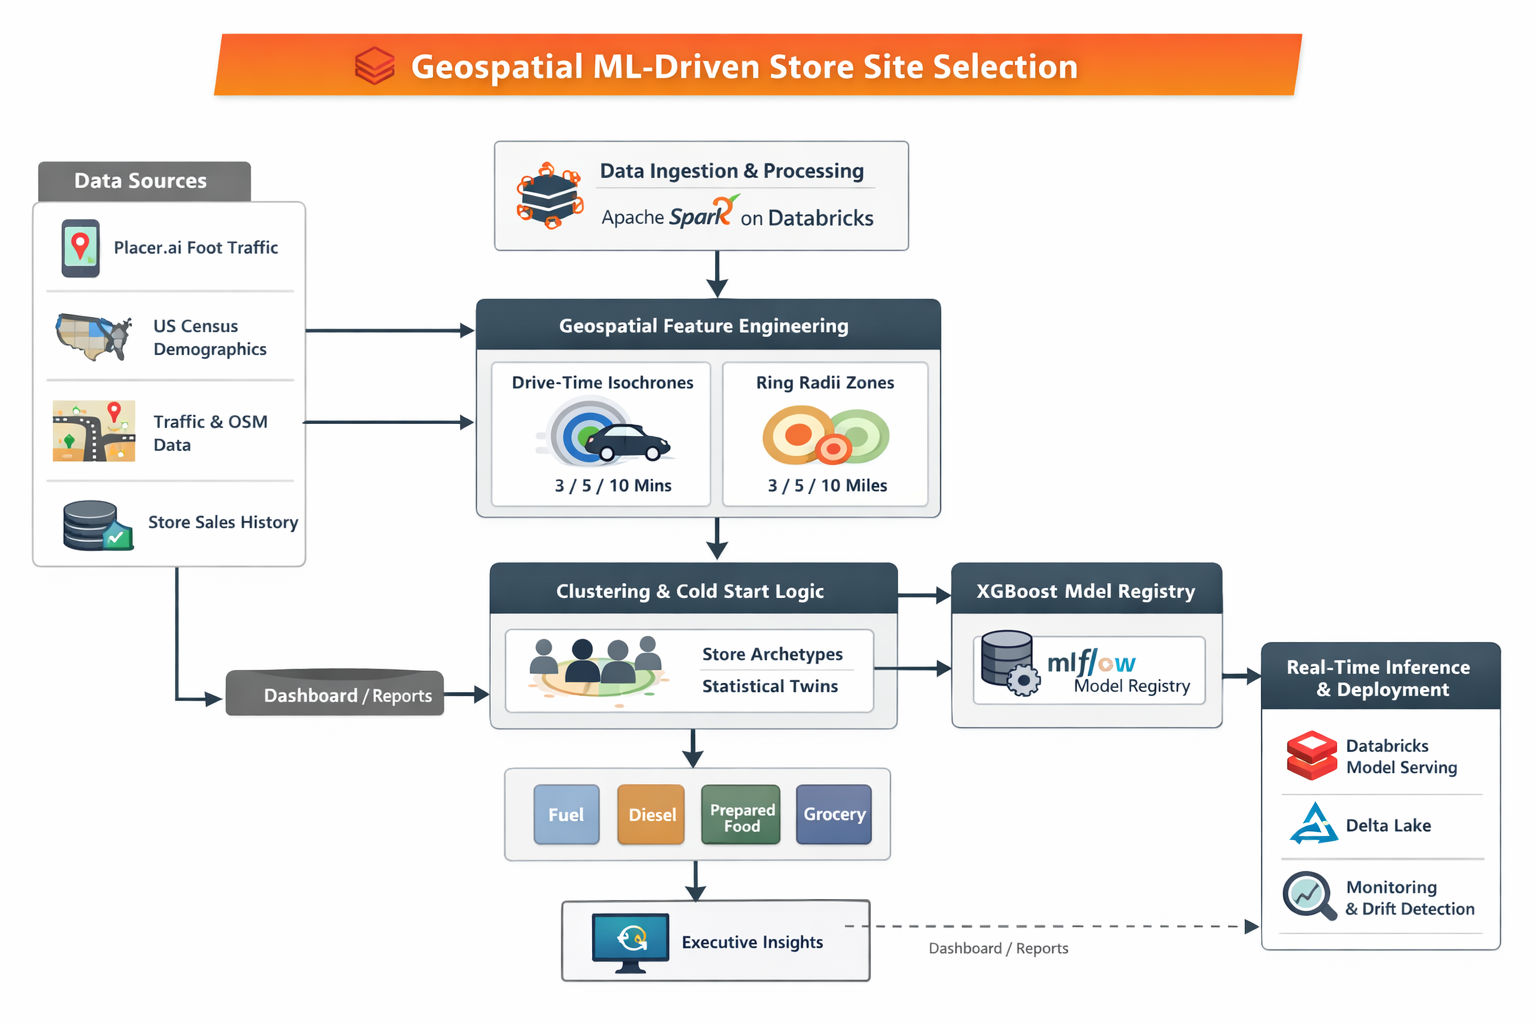
5. Spatial Feature Engineering
Trade Area Definition (Critical Design Decision)
Instead of a single radius, each site is evaluated using dual spatial lenses:
1. Drive-Time Isochrones (3 / 5 / 10 mins)
- Captures real accessibility
- Models friction from road topology
2. Ring Radii (3 / 5 / 10 miles)
- Captures broader trade dynamics
- Important for diesel & highway-driven behavior
This framework standardized feature extraction across all data sources.
6. Feature Engineering at Scale (1,700+ Features)
Positive Drivers
- Schools, stadiums, highways
- Placer.ai footfall density
- Gas pumps, kitchen layout, store design
Negative Drivers
- Competitor proximity
- Turn complexity (wrong-side access)
- Road network constraints
Handling High Dimensionality
- Store Archetype Clustering
- Rural / Suburban / Urban
- SHAP-based Feature Pruning
- Preserved explainability
- Reduced noise
7. Spatial & Data Integrity Challenges
Graph-Based Proximity Logic
- Euclidean distance was insufficient
- Built road-network graphs
- Calculated true drive-time distances
- Captured one-way roads, dividers, access friction
Shapefile Processing
- GeoPandas + Spark
- Point-in-Polygon joins against census blocks
- Accurate socio-economic attribution per trade area
Extreme Value Imputation
- Rural isolation handled explicitly
- Missing competitors → distance set to
9999 - Treated as a signal, not a null
8. Model Architecture
Multi-Vertical Forecasting
Separate XGBoost regressors for:
- Diesel
- Gasoline
- Prepared Food
- Grocery
Each model prioritized different spatial and demographic drivers.
Cold-Start Strategy (Dual Clustering)
- Cluster historical stores by performance
- Cluster US geography by NTI-available features
- Map NTI site → statistical twin
This provided contextual grounding before regression.
9. Training Strategy
Data Splitting
- Stratified (not time-based)
- Stratified by:
- Store tier
- Geography
- 70 / 15 / 15 with locked test set
Validation
- 5-fold cross-validation
- GridSearchCV for:
- Depth
- Learning rate
- Subsampling
Imbalance Handling
scale_pos_weight- Synthetic weighting for top 5% performers
10. Compute Optimization
Hybrid Compute
- Spark clusters → feature engineering
- Single-node multi-GPU → XGBoost training
- 5× faster grid search vs distributed CPU
Cost Controls
- Sliding-window spatial caching
- Haversine pre-filtering (60% pruning)
- Serverless model serving (scale-to-zero)
11. Evaluation Metrics
Primary Metric: WMAPE
- Reflects business cost asymmetry
- Penalizes high-volume errors more heavily
Benchmarking
- 3rd-party baseline: 50% accuracy
- Acceptance threshold: 65%
- Achieved: 65%+ consistently
12. Explainability & Trust
SHAP-Based Transparency
- Global drivers for leadership
- Local reason codes per site
Example:
Highway traffic (+20%), schools (+15%) outweigh competitor proximity (-5%)
Bias & Audit Readiness
- Full MLflow lineage
- Feature-level bias inspection
- Reproducible forecasts
13. Deployment Architecture
Feature Consistency
- Delta Lake Silver → shared by training & serving
- Eliminated training-serving skew
Serving
- Databricks Model Serving
- Notebook-based UAT with widgets
- Millisecond inference latency
14. Monitoring & Drift Detection
- ±8% WMAPE guardrails
- Spatial trade-area drift detection
- Annual census-driven retraining
- Human-in-the-loop overrides logged for supervision
15. Rollout Strategy
- Shadow mode backtesting
- Regional pilots (Des Moines, Little Rock)
- Champion / Challenger vs 3rd-party
- Full self-service production rollout
16. Technical Alternatives Evaluated (and Rejected)
Time-Series Models
- Prophet / SARIMA failed on spatial shocks
- High dimensionality collapse
Bayesian MCMC
- No convergence at scale
- Prohibitively expensive
Why XGBoost Won
- Non-linear feature handling
- Efficient at scale
- Strong spatial generalization
17. Business Impact
- 15% accuracy lift
- Millions in avoided CAPEX risk
- Decommissioned expensive 3rd-party tooling
- Standardized national expansion strategy
18. What I’d Do Differently Today
- Huff gravity model for continuous trade influence
- Graph Neural Networks for topology-aware learning
- Real-time mobility ingestion for near-live adaptation
Key Skills Demonstrated
- Databricks & Spark at scale
- Advanced geospatial feature engineering
- Production ML governance (MLflow, Delta)
- Cost-aware cloud architecture
- Explainable ML for executive decisions
High-Level Architecture