Category Analytics Agentic Solution
1. Problem Context & Business Objective
Category managers were responsible for evaluating category performance across 12+ dimensions such as traffic source, geography, device type, and time frames. Each dimension had multiple levels (e.g., traffic source L1/L2), resulting in over 100 possible analytical combinations per category. Considering each metric along with the relations is cumbersome process.
Weekly and monthly performance reviews were critical inputs for:
- sales and marketing budget allocation
- incentive planning
- category-level performance decisions
However, generating these insights required manual exploration of multiple dashboards and reports, making the process time-consuming, error-prone, and heavily dependent on analyst support.
The evaluation process:
- consumed significant analyst and manager time every week
- did not scale as the number of categories and regions grew
- risked inconsistent or biased interpretation across teams
Stakeholders included category managers, regional managers, and sales & marketing leadership (VP level), all of whom required fast, reliable, and explainable insights to support decision-making.
The objective was to automate performance analysis across multiple dimensions, surface actionable insights, and reduce dependency on manual reporting while maintaining cost and latency constraints.
Key Constraints
- Cost-sensitive LLM usage due to frequent (weekly) report generation
- End-to-end response time under 20 seconds for interactive use
- Large structured datasets requiring hierarchical and cross-dimensional analysis
- Weekly data refresh cadence with consistent historical comparisons
2. Why ML / LLM-Based Approach?
We initially evaluated a rule-based system to codify performance evaluation logic. However, this approach proved unsuitable for several reasons:
- The number of rules required grew rapidly with the number of dimensions, categories, and business contexts, making the system difficult to maintain and scale.
- Rule definitions were highly subjective and varied across teams, introducing bias and inconsistency into performance assessments.
- Rules required frequent manual updates to reflect changing business conditions, offering no learning or optimization over time.
- Customizing rules per category increased operational overhead without significantly improving insight quality.
- We have an already operational Tableau dashboard that shows all metrics but it quickly becomes overwhelming when we try to evaluate relationships between all the dimensions and their metric values.
We also considered relying solely on dashboards and static KPI thresholds. While useful for monitoring, these approaches required significant manual interpretation and did not scale well for multi-dimensional exploratory analysis.
The core requirement was to provide category managers with a pre-computed, consistent starting point for performance interpretation- one that could synthesize signals across multiple dimensions without explicitly encoding rules.
An LLM-based evaluation layer was chosen to:
- Aggregate and reason over large, structured performance datasets across hierarchical dimensions.
- Reduce manual interpretation effort while maintaining explainability.
- Provide consistent summaries and insights across categories and regions.
- Scale across categories without per-category rule customization.
This approach optimized for decision velocity and consistency rather than replacing human judgment, enabling leadership teams to focus discussions on actions rather than data discovery.
3. Data Landscape
The primary data source for this project resided on an internal Big Data Platform (BDP), which exposed large-scale transactional datasets through shared query engines. While the platform supported direct querying, query latency was highly variable due to resource contention across multiple teams.
To ensure predictable performance and isolation from upstream workloads, a dedicated ETL pipeline was designed to extract and materialize the required datasets on a scheduled basis, aligned with downstream consumption needs.
The underlying transactional data was at terabyte scale and optimized primarily for write-heavy ingestion rather than analytical workloads. There was no dedicated OLAP layer available for this use case, as most teams relied on ad-hoc SQL aggregations for reporting.
For this project, performance reports needed to be refreshed on a weekly cadence. Although the source data was updated hourly from live systems, the solution required controlled snapshots to enable consistent week-over-week comparisons while limiting data volume and compute costs.
4. Feature Engineering & Data Representation
The first design decision was to operate in an extract-based mode rather than a live data connection. Given that performance reviews were conducted on a weekly cadence and downstream actions required multiple days to implement, near-real-time data did not provide meaningful additional value. A batch extraction approach enabled predictable performance, lower cost, and consistent snapshots for week-over-week analysis.
The feature set was constructed by aggregating transactional data into an OLAP-style representation. Aggregations were executed upstream using SQL and materialized as partitioned Parquet files to optimize query performance and downstream processing.
Features were grouped into four primary categories:
- Sales metrics (revenue, conversion, growth trends)
- Marketing metrics (traffic sources, campaign performance)
- User engagement metrics (visits, retention signals)
- Finance metrics (budget allocation, spend efficiency)
In addition to raw aggregates, several derived metrics already used by business teams were computed during the ETL process. This ensured continuity with existing evaluation practices while eliminating manual calculations. Since the granularity which we need for LLM is at Region-Category-Timeframe all the tables have been aggregated at this granularity.
An external “market pulse” signal was introduced to capture category-level trends from public internet sources. Previously, category managers spent significant manual effort collecting this information daily. Incorporating this signal as a feature allowed the model to contextualize internal performance metrics with external demand trends, which directly influenced marketing budget decisions.
To ensure consistency and interpretability, all feature values were normalized and stored with explicit unit annotations (e.g., currency, percentage points). Missing values were imputed using metric-specific defaults based on business relevance rather than generic statistical methods, ensuring that absence of data did not distort downstream reasoning.
This feature engineering approach reduced high-volume transactional data into a compact, semantically consistent representation optimized for downstream ML and LLM-based analysis.
5. Model Choice
The solution was designed to operate within existing enterprise AI governance constraints. All large language models were centrally hosted and managed by a dedicated platform team responsible for responsible AI, security, and compliance. As a result, model selection was limited to approved options, primarily GPT-4o and Gemini.
To evaluate suitability, a comparative assessment was conducted using representative performance datasets across multiple categories. Both models were prompted with identical structured inputs, and the generated insights were reviewed by business stakeholders using a qualitative scoring framework (1–5) based on relevance, clarity, and actionability. GPT-4o consistently scored higher, particularly in synthesizing multi-dimensional signals into concise insights, and was selected as the primary model.
Model selection was decoupled from application logic through an abstraction layer, allowing endpoints to be switched or re-evaluated in later stages without changes to downstream pipelines. This ensured flexibility as newer models or improved versions became available.
A traditional deep learning approach was also considered. However, the primary challenge was not pattern recognition over raw data but reasoning across aggregated, hierarchical metrics with evolving business semantics. Training and maintaining a custom model would have required continuous retraining, labelled data generation (highly dependent on the existing users), and complex interpretability workflows, without clear benefits over an LLM-based reasoning layer.
Trade-offs
- Accuracy vs Interpretability: LLM-based summaries provided explainable, human-readable insights compared to opaque scoring models.
- Latency: All candidate models were hosted within the same environment with comparable infrastructure, resulting in similar response times that met the sub-20-second requirement.
- Cost: Prompt size and invocation frequency were controlled through upstream aggregation and batch execution to remain within budget constraints.
- The user level usage budget (credit system) was added to ensure that proper budget can be allocated to teams that are using it.
This architecture prioritized decision consistency, extensibility, and governance compliance over marginal gains in raw model accuracy.
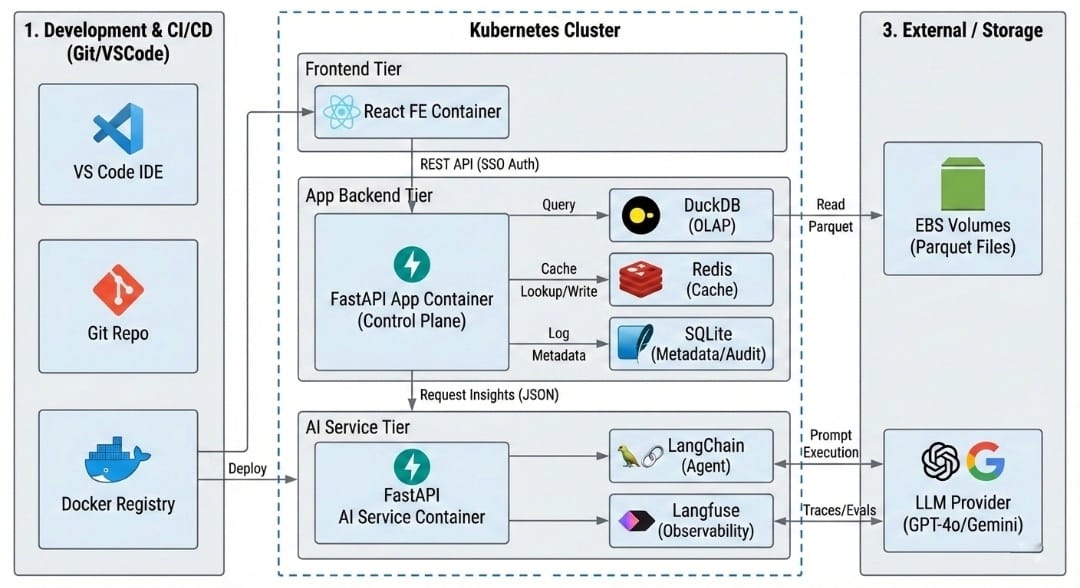
6. System Architecture
The system follows a modular, service-oriented architecture with strict separation between user-facing services and AI execution. This design enables independent scaling, cost control, and governance of LLM workloads while keeping application latency predictable.
Tech Stack Decisions
The technology stack was selected based on maintainability, team skill alignment, and time-to-market constraints, while ensuring sufficient flexibility for future scaling.
Python was chosen as the primary implementation language since the project sits within the data analytics vertical and requires tight integration with data processing, feature engineering, and AI workflows. Using Python minimizes operational complexity and allows a single language across ETL, backend services, and AI logic.
The extended engineering team already has strong proficiency in Python and SQL, which reduces onboarding time and lowers long-term maintenance risk.
Backend Framework
FastAPI was selected as the application and AI service framework due to:
- Native support for asynchronous request handling
- Strong typing and schema validation via Pydantic
- Low overhead compared to full-stack frameworks
- Clear API contracts suitable for service-oriented architectures
Django was evaluated but not chosen due to its heavier ORM-centric design, which was unnecessary given the read-heavy, analytics-focused workload. Flask was also considered but rejected due to the lack of built-in structure and validation, which would increase long-term maintenance effort.
Frontend Framework
Streamlit was evaluated for rapid prototyping but was not selected due to:
- Limited support for complex user interactions
- Constraints on data access control and role-based experiences
- Challenges in scaling to multi-user, enterprise-grade applications
React was chosen instead to support:
- Fine-grained control over user interactions
- Role-based UI rendering
- Better separation between presentation and backend logic
Overall, the selected stack provides a balanced trade-off between development velocity, operational stability, and architectural extensibility.
High-Level Components
Frontend (React)
- Enterprise SSO-based authentication and session initiation
- Role-based access control to dashboards and reports (category manager, regional manager, leadership)
- Interactive filtering (category, region, time window) with stateless UI rendering
- Auth-aware API consumption using secure session tokens
- No direct interaction with LLM or data storage layers to minimize exposure
The frontend is intentionally kept thin, focusing only on visualization and user interaction.
Application Backend (FastAPI)
- Asynchronous request orchestration using non-blocking I/O
- Acts as the control plane for:
- authentication and authorization
- data access
- prompt assembly
- response post-processing
- Aggregated OLAP datasets mounted and queried using DuckDB for low-latency analytical access
- Server-side session management via secure cookies
- Controlled delegation of LLM execution to the AI Service
- Response caching to serve repeated or overlapping queries efficiently
- Redis used for short-lived, high-concurrency cache
- SQLite used for lightweight persistence (user sessions, metadata, audit logs)
This service enforces all business rules and ensures that only sanitized, pre-aggregated data is passed downstream.
AI Service (FastAPI)
- Dedicated service responsible solely for AI inference
- Encapsulates:
- prompt execution
- LLM provider interaction
- output normalization
- Model abstraction layer enables easy switching between LLM providers without upstream changes
- Request-level caching to avoid repeated LLM calls for identical inputs
- Guardrails for:
- prompt validation
- response schema enforcement
- output consistency checks
- Token usage and cost tracking at user and team levels
- Budget enforcement logic to prevent cost overruns and support enterprise chargeback
Isolating this service allows independent scaling, stricter governance, and controlled experimentation with LLMs.
Data Layer
- Weekly aggregated OLAP-style parquet datasets stored on EBS volumes
- Parquet directories mounted into containers for read-only analytical access
- Seller level table and PII data has been anonymised for compliance
- Parameterized ingestion queries stored as YAML for:
- readability
- auditability
- fast iteration without code changes
- Cached inference outputs stored for:
- compliance
- audit
- historical analysis of insight evolution
Raw transactional data never leaves the data platform boundary.
This separation ensures that LLM execution — which is cost- and latency-sensitive — remains isolated from user-facing application logic, while still allowing seamless integration.
7. Data Flow
- Scheduled ETL jobs aggregate high-volume transactional data into analytical feature sets on a weekly cadence.
- The application backend retrieves pre-aggregated features based on user context and access rights.
- Features are transformed into structured, schema-driven prompt inputs.
- The AI service performs LLM inference and returns normalized insights.
- Results are cached, logged, and served to frontend clients.
Batch execution is preferred over real-time inference to control cost, ensure consistency across stakeholders, and reduce variance in analytical interpretation.
Why Not Real-Time Inference?
Real-time inference was explicitly evaluated and intentionally excluded from the system design.
The primary consumers of this solution use the reports on a weekly decision cadence (budget allocation, performance reviews, and planning discussions). Generating insights in real time would not materially change downstream actions or improve business outcomes.
From a data and systems perspective:
- Source data is transactional and updates hourly, but analytical conclusions require aggregation across longer windows.
- Real-time inference would introduce noise without improving signal quality.
- The OLAP layer is designed for stable, comparable snapshots rather than continuously shifting views.
From an operational standpoint:
- Real-time LLM inference would significantly increase token consumption and infrastructure cost without proportional value.
- It would introduce variability in insights due to partial data availability and transient trends.
- Batch execution enables deterministic, repeatable outputs across stakeholders.
Given these considerations, a batch-oriented inference model aligned with data refresh cycles and business decision timelines provides the optimal balance of cost efficiency, consistency, and analytical reliability.
8. Prompt Engineering & Input Representation
To control token usage and improve determinism, prompts are constructed using structured templates rather than raw text.
Prompt Design Principles
- Hierarchical encoding (Category → Subcategory → Metric)
- Explicit metric definitions and units
- Instruction separation from data payload
- Deterministic output schema (JSON-based)
Prompt templates are versioned and managed independently from application code to allow iterative refinement.
9. API Design & Contracts
The API layer is designed with clear separation between application orchestration and AI execution. All endpoints enforce strict request and response schemas to ensure security, predictability, and downstream compatibility.
Application Backend APIs
-
GET /login-url
Redirects users to the enterprise SSO provider for authentication and returns them to the web application upon successful login. -
GET /auth-me
Validates the active user session and returns user metadata such as user ID, name, and role attributes. -
GET /category-list
Returns the list of unique filter values (categories, regions, time windows) required for frontend filter rendering. -
POST /wbr
Accepts user-selected filter parameters and returns a single consolidated JSON response containing:- aggregated tables
- derived metrics
- LLM-generated summaries
This endpoint acts as the primary orchestration layer for report generation.
AI Service APIs
-
POST /llm/summary
Accepts structured input data from the application backend, validates prompt and response schemas, and executes the agentic LLM workflow to generate insights. -
GET /llm/async
Enables asynchronous LLM execution mode to support concurrent user requests and long-running inference tasks.
Strict schema validation is enforced at all service boundaries to mitigate prompt injection risks and ensure stable integration across components.
10. Performance, Scaling & Cost Controls
Scaling Strategy
- Horizontal scaling of FastAPI services using stateless containers
- Authorisation endpoint with multiple workers scaling is used
- Batch LLM inference for weekly reporting
- Async request handling and connection pooling for managing concurrent requests
- Using SQLite with 50 wps limit for handling the user requests caching
Cost Controls
- Prompt size reduction via upstream aggregation
- Flat JSON and dropping stop words to reduce token usage
- Output caching for repeated queries
- Rate limiting per user and per role
- Centralized cost monitoring per model invocation
The architecture is designed to support increased category and region coverage without linear growth in LLM usage.
11. Reliability & Failure Handling
Failure Scenarios
- Partial data availability
- LLM timeout or degraded response quality
- Upstream ETL delays
- Budget or quota exhaustion
Mitigations
- Fallback to last successful report
- Graceful degradation with partial insights
- Retry logic with exponential backoff
- Alerting on anomaly detection in response quality
12. Security & Governance
- Role-based access control enforced at API level with SSO authentication
- No raw transactional data sent to LLM services
- Server side cookie created and shared with frontend for authentication
- Prompt sanitization and schema validation
- Centralized logging and audit trails
This aligns with enterprise data security and responsible AI requirements.
13. Monitoring & Observability
Metrics Tracked
- API latency and error rates
- LLM invocation counts and cost
- Prompt size distribution and token count validation
- Output consistency scores
Logs and metrics are used to continuously refine prompt design and cost-performance trade-offs.
14. Deployment & Environment Strategy
- Containerized deployment (Docker)
- Separate environments for dev, staging, and prod
- CI/CD with automated schema validation
- Feature flags for controlled rollout of prompt or model changes
15. Extensibility & Future Enhancements
- Plug-and-play support for alternative LLM providers
- Automated output evaluation using ML-based scorers
- User feedback loop for continuous improvement
16. Key Design Decisions Summary
- Chose batch inference over real-time to optimize cost and consistency
- Isolated AI service for governance and scalability
- Prioritized explainability and stakeholder trust over black-box scoring
- Designed for model and prompt evolution without system rewrites
17. Lessons Learned and Future Opportunities
- Chose batch inference over real-time to optimize cost and consistency
- We can scale this application for 1000+ users if we use Django
- Creation of Redis for storing API responses in combination with the SQLite will provide a faster and robust caching